

Yesterday morning—a good morning—I sat for an hour with Kevin Grove here in Bend. Kevin has been in town a while, and he helped found our local avalanche center, COAC. We discussed something adjacent to avalanches. We spoke of risk and luck and our own shifting risk profiles. But mostly, we spoke of personal loss and how the ripple effects of that loss certainly dissipate over time, but it still ripples.
One thing we did not speak about, but I’ll dive into here a bit, is the data we use to make a certain decision—like whether to descend a slope tenusouly or hooting and hollering or not to descend the slope at all. I think if I’m honest with myself, there’s really never a single thing I can pinpoint as to why I pivot to yes or no, or even a maybe, when considering if I’ll move through certain terrain. And although I use my phone to navigate through terrain on occasion, it’s usually in places I’m unfamiliar with. I use onX Backcountry. Which is not to say that other mapping apps, or a combo of mapping apps, are not viable. (I do like the combo of apps approach when exploring complex and new zones.) onX has incorporated several solid features related to avalanche forecasts over the past few years. One of which is the Avalanche Terrain Exposure Scale (ATES). We’ve covered the ATES scale and even onX’s adoption of it, which is where we are going here, in the past.
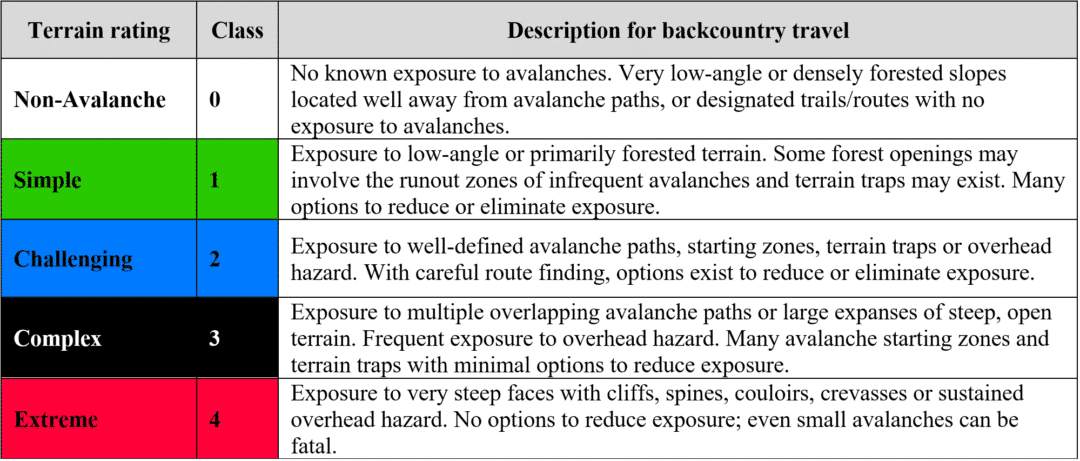
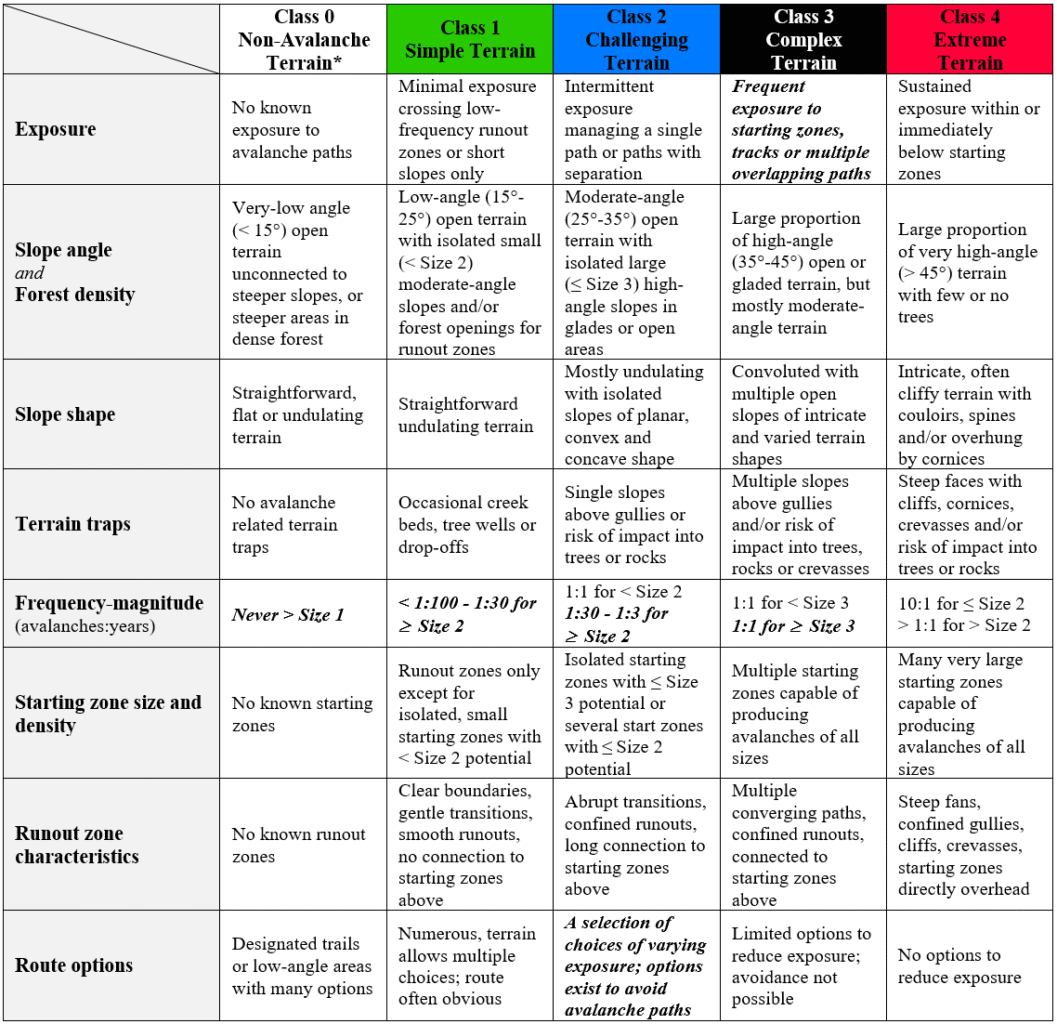
Here’s what Avalanche Canada says about ATES: “The Avalanche Terrain Exposure Scale, or ATES, is a system of rating backcountry terrain based on its exposure to avalanches.” Key point: this scale does not take into consideration the day’s avalanche forecast. It is static.
Here is the ATES Scale:
THR’s past ATES Coverage:
Read up on ATES and trip planning.
And if you want to go to the source, here is a good read for background.
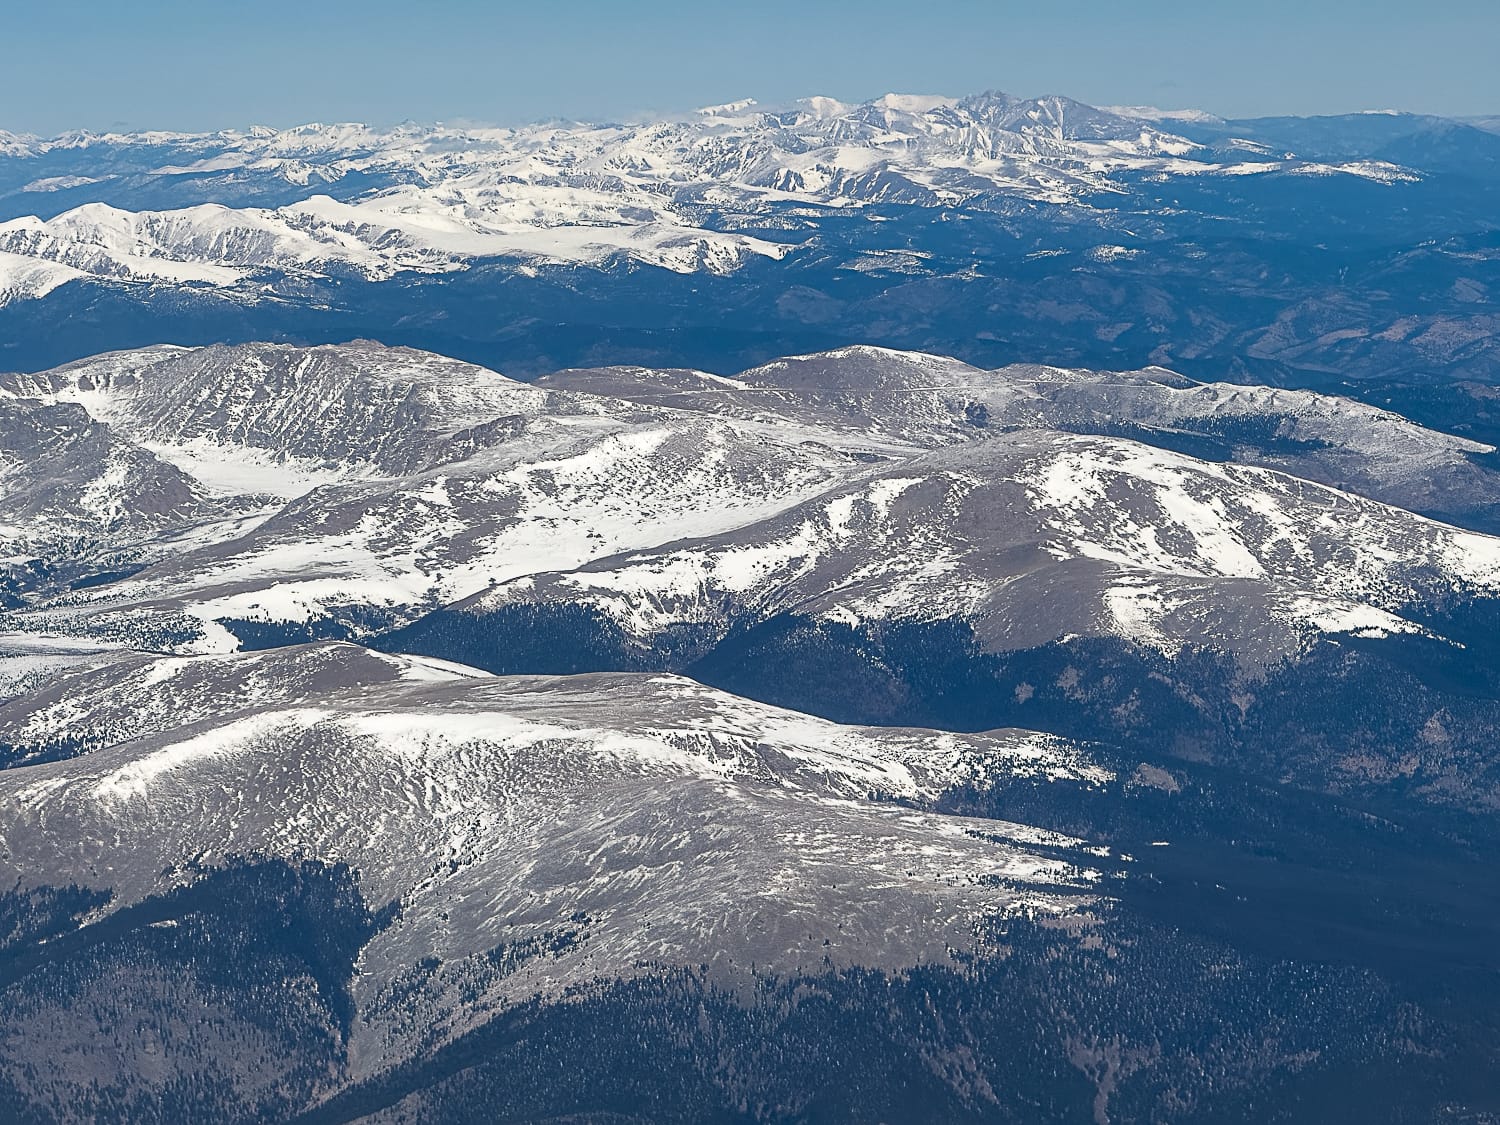
Yesterday, onX announced it had made svereal new ATES zones public on its app. (We’ll list those zones below.) And they are a considerable addition, onX claims it has added “23 million acres across ten states.” Kudos to onX for investing resources in developing its backcountry-specific offering.
Here are the new/expanded regions:
Washington: 3,918,667 New Acres
- North Cascades 934,590 acres
- Mount Saint Helens and Rainier 1,477,459 acres
- Mount Adams 729,853 acres
- Leavenworth 776,765 acres
Colorado: 3,676,474 New Acres
- Western San Juan Mountains 909,207 acres
- Leadville and Aspen 1,651,722 acres
- Pikes Peak 176,689 acres
- Indian Peaks 374,470 acres
- Gore Range, Summit to Steamboat 564,386 acres
Montana: 3,236,578 New Acres
- Whitefish 1,114,385 acres
- Rattlesnake 360,000 acres
- Bitterroots 1,342,193 acres
- Seeley Lake 420,000 acres
Wyoming: 2,272,651 New Acres
- Togwotee Pass 1,114,621 acres
- Alpine and Afton 1,158,030 acres
California: 1,420,011 New Acres
- Sonora Pass and Ebbets Pass 581,831 acres
- Eastern Sierra 838,180 acres
Oregon: 462,143 New Acres
- Central Cascades 462,143 acres
How is this ATES tool useful? I know I ask these questions, and let’s assume others may ask, too. For me, it is in the planning stage when I’m using an app to choose a safe and hopefully efficient line into and out of an area I would like to ski. And almost categorically, I employ the ATES layer in onX when I’m truly unfamiliar with an area. Although I am sure some use this feature when at the micro-level, I’m more often than not using it at the macro level, and before I’m actually on snow. For example, I’m currently planning a traverse with my older son in Canada for the spring. I’ll be sure to consider the ATES layer when we decide on a reasonable path to take. The ATES has been used in Canada for over two decades. It is not new. This is not some latest and greatest data crunch that adds another nicely colored layer on our maps. Like any other map layer, especially those relating to decisions we make regarding avalanches, it’s a layer on a map. And as humans, likely with other humans in the moment, making decisions about what to ski/ride and what not to ski/ride, there will be discussions and disagreements. It’s a reminder to look around. What do you see? What do you feel? What do your partners see and feel? Regardless of the forecast for the day or the ATES rating, there will surely be discussions. And then you’ll consider risk, luck, and your own personal risk profile, as well as how that may ebb and flow on any given day. But when considering the daily forecast, and maybe a whoompf you heard as the snow settled underfoot, or some wind loading you find that you didn’t expect, the ATES scale will likely (hopefully) make you wiser. Because where there is luck, there is also bad luck.
Leave a Reply
You must be logged in to post a comment.