
The days are short, but they are beginning to feel long in some low-snow regions. And there are many of them. Good people on the East Coast, we understand, this is not you.:)
It has been a minute since we had a SWE update, which, for the record, is a fun exercise for us, as it usually trends positively through much of the touring season. And while the concept of a snow dance is quaint and even ritualistic for some, we’ve generally abstained and have focused on overriding weather models and patience. We are not, however, short on patience, but at some point, we might be. Which means we may have to brave a border crossing (we aspire to be good neighbors) and bolt up to Canada. It does look more promising for our peeps up north.
Let’s drill down. But we’ll forgo the usual region-by-region map, because it simply looks grim no matter how you slice it. (This, again, is a broad statement, and we understand some may have good snow and stable snow.) Much of the West lacks snow in any form to even cover rocks and duff and dirt. (Now known as dust on diff. when it seems semi-snow slidable.) Some parts of the West have snow, but they are struggling with snowpack instabilities.
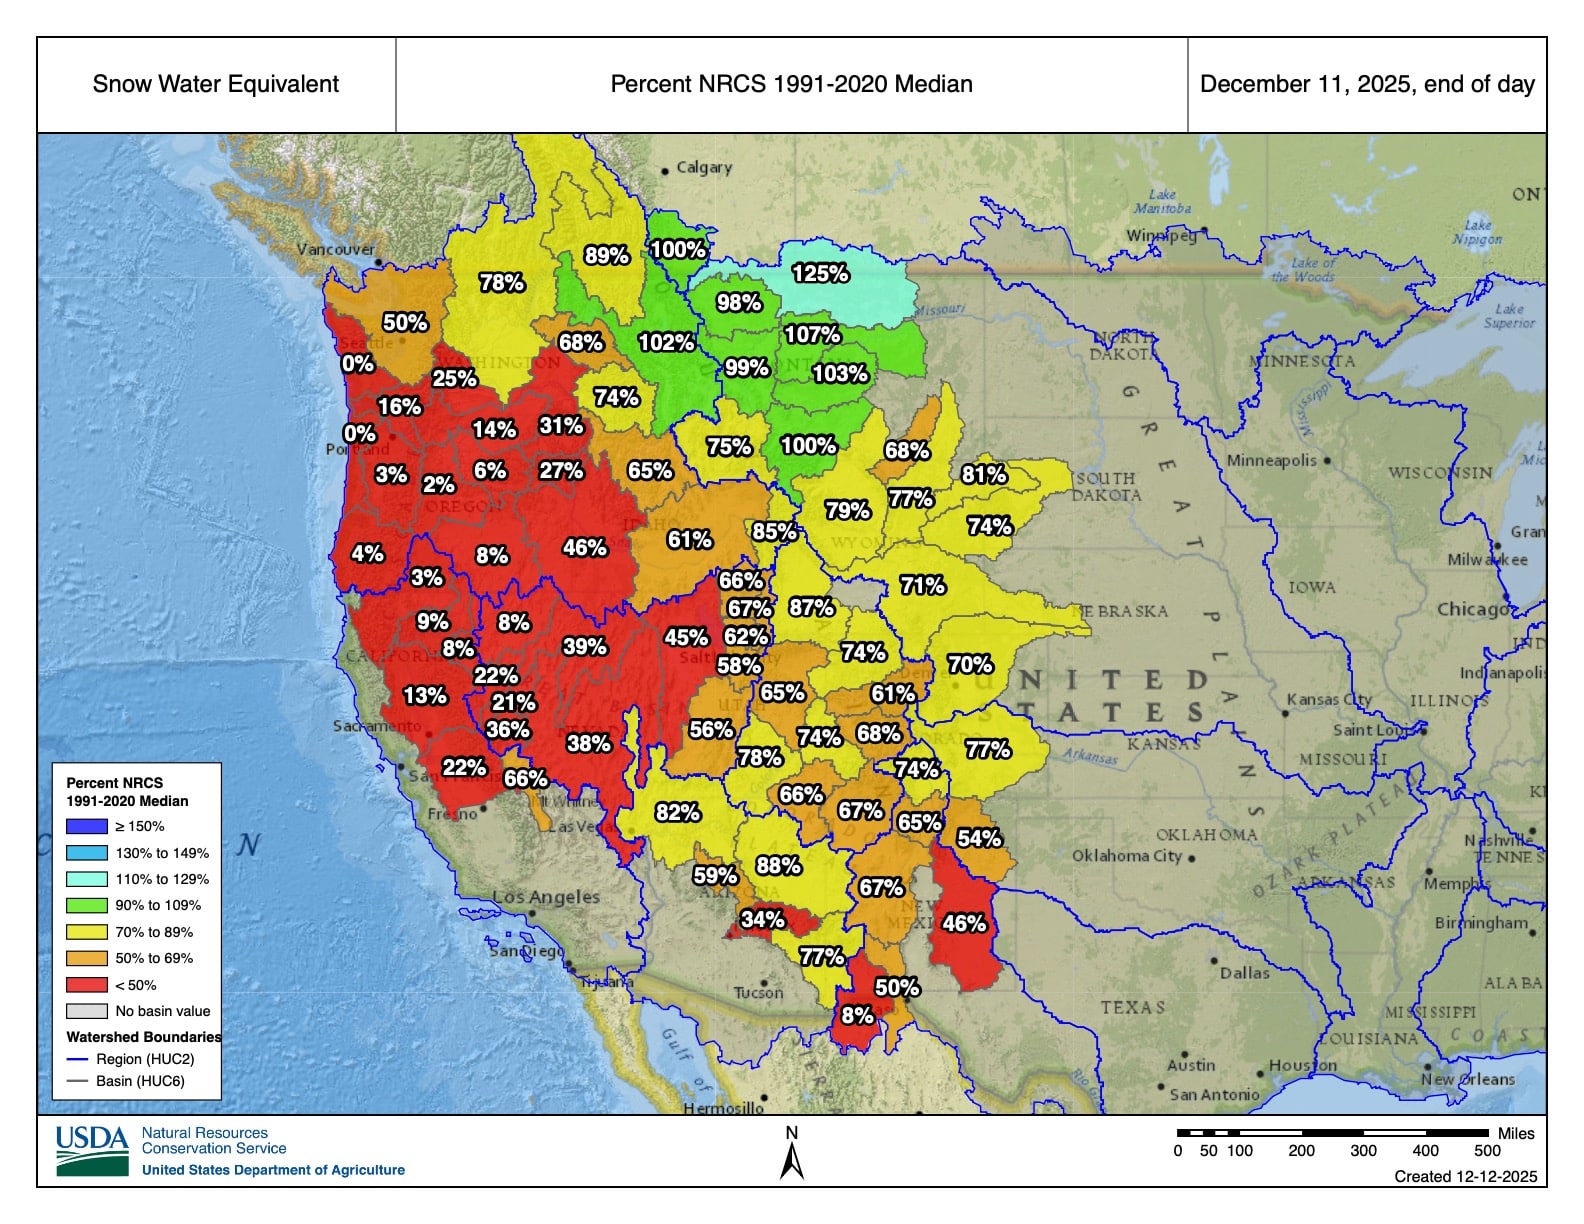
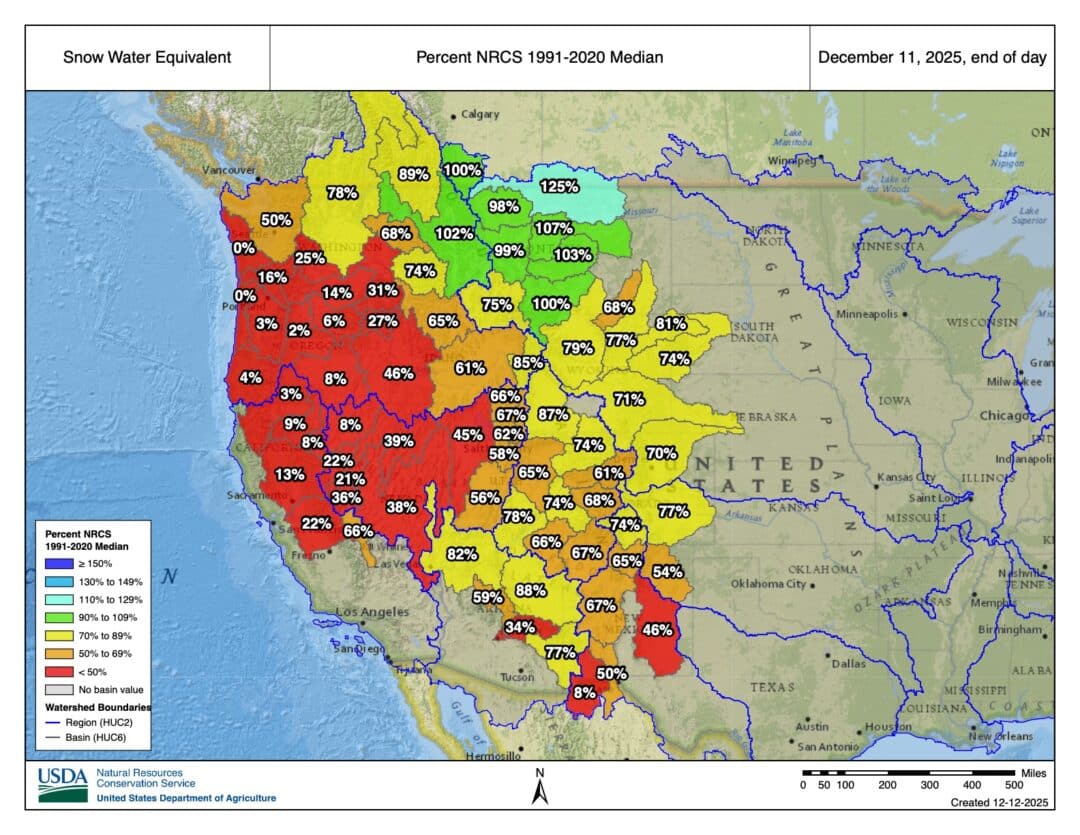
So here it goes….image #1…so much red. Go ahead, look. Do not be afraid. But do we need to get granular? We think not. Red is the trend in the western half of the West. And trending east, it does, for the most part, look more promising. The SWE trends toward oranges, then yellows, and even some glorious green in places like Montana.
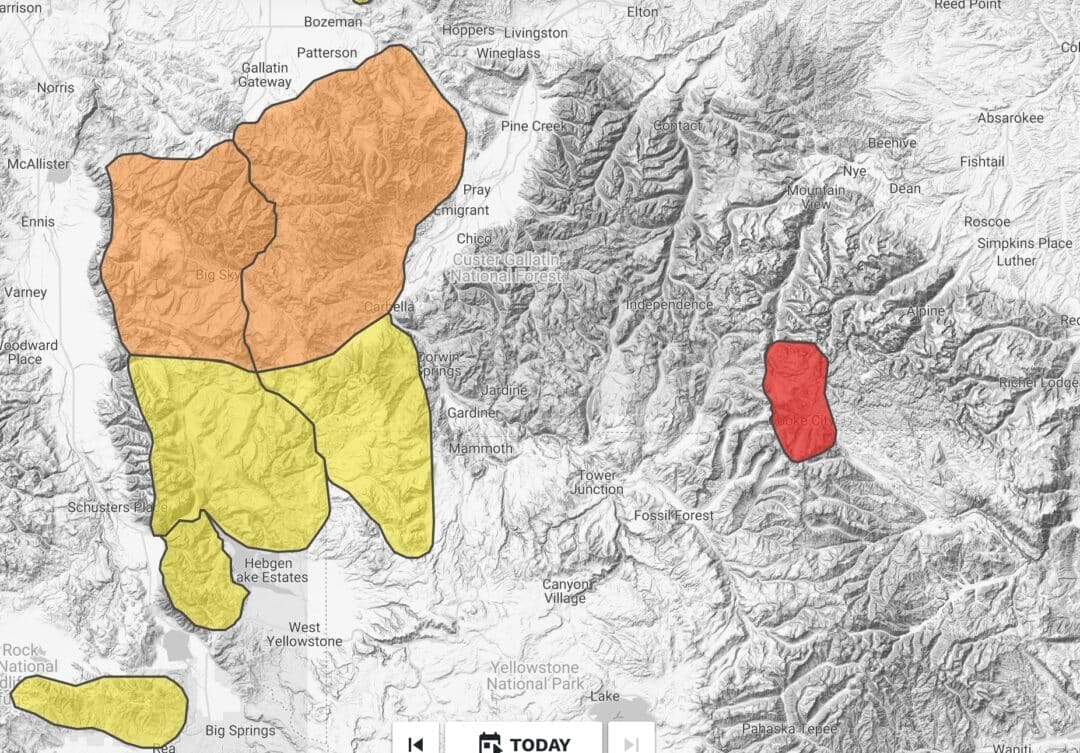
That green means some mountains are experiencing unstable snow (we’re looking at you, Cooke City). As always, there’s the yin and the yang.
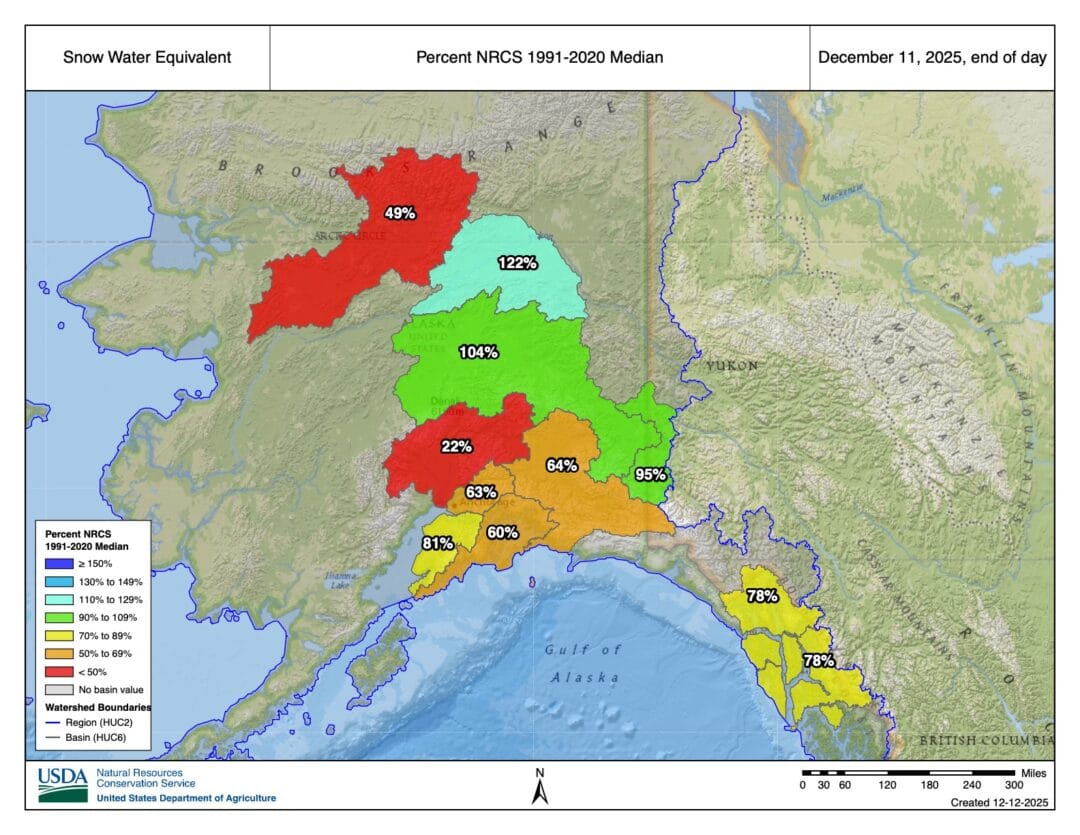
Alaska has it a bit better (don’t they always) relative to the meager snow portions in the West. But, still, they, too, are wanting. Are they snow dancing up there? Who knows. Maybe it is not that desperate.
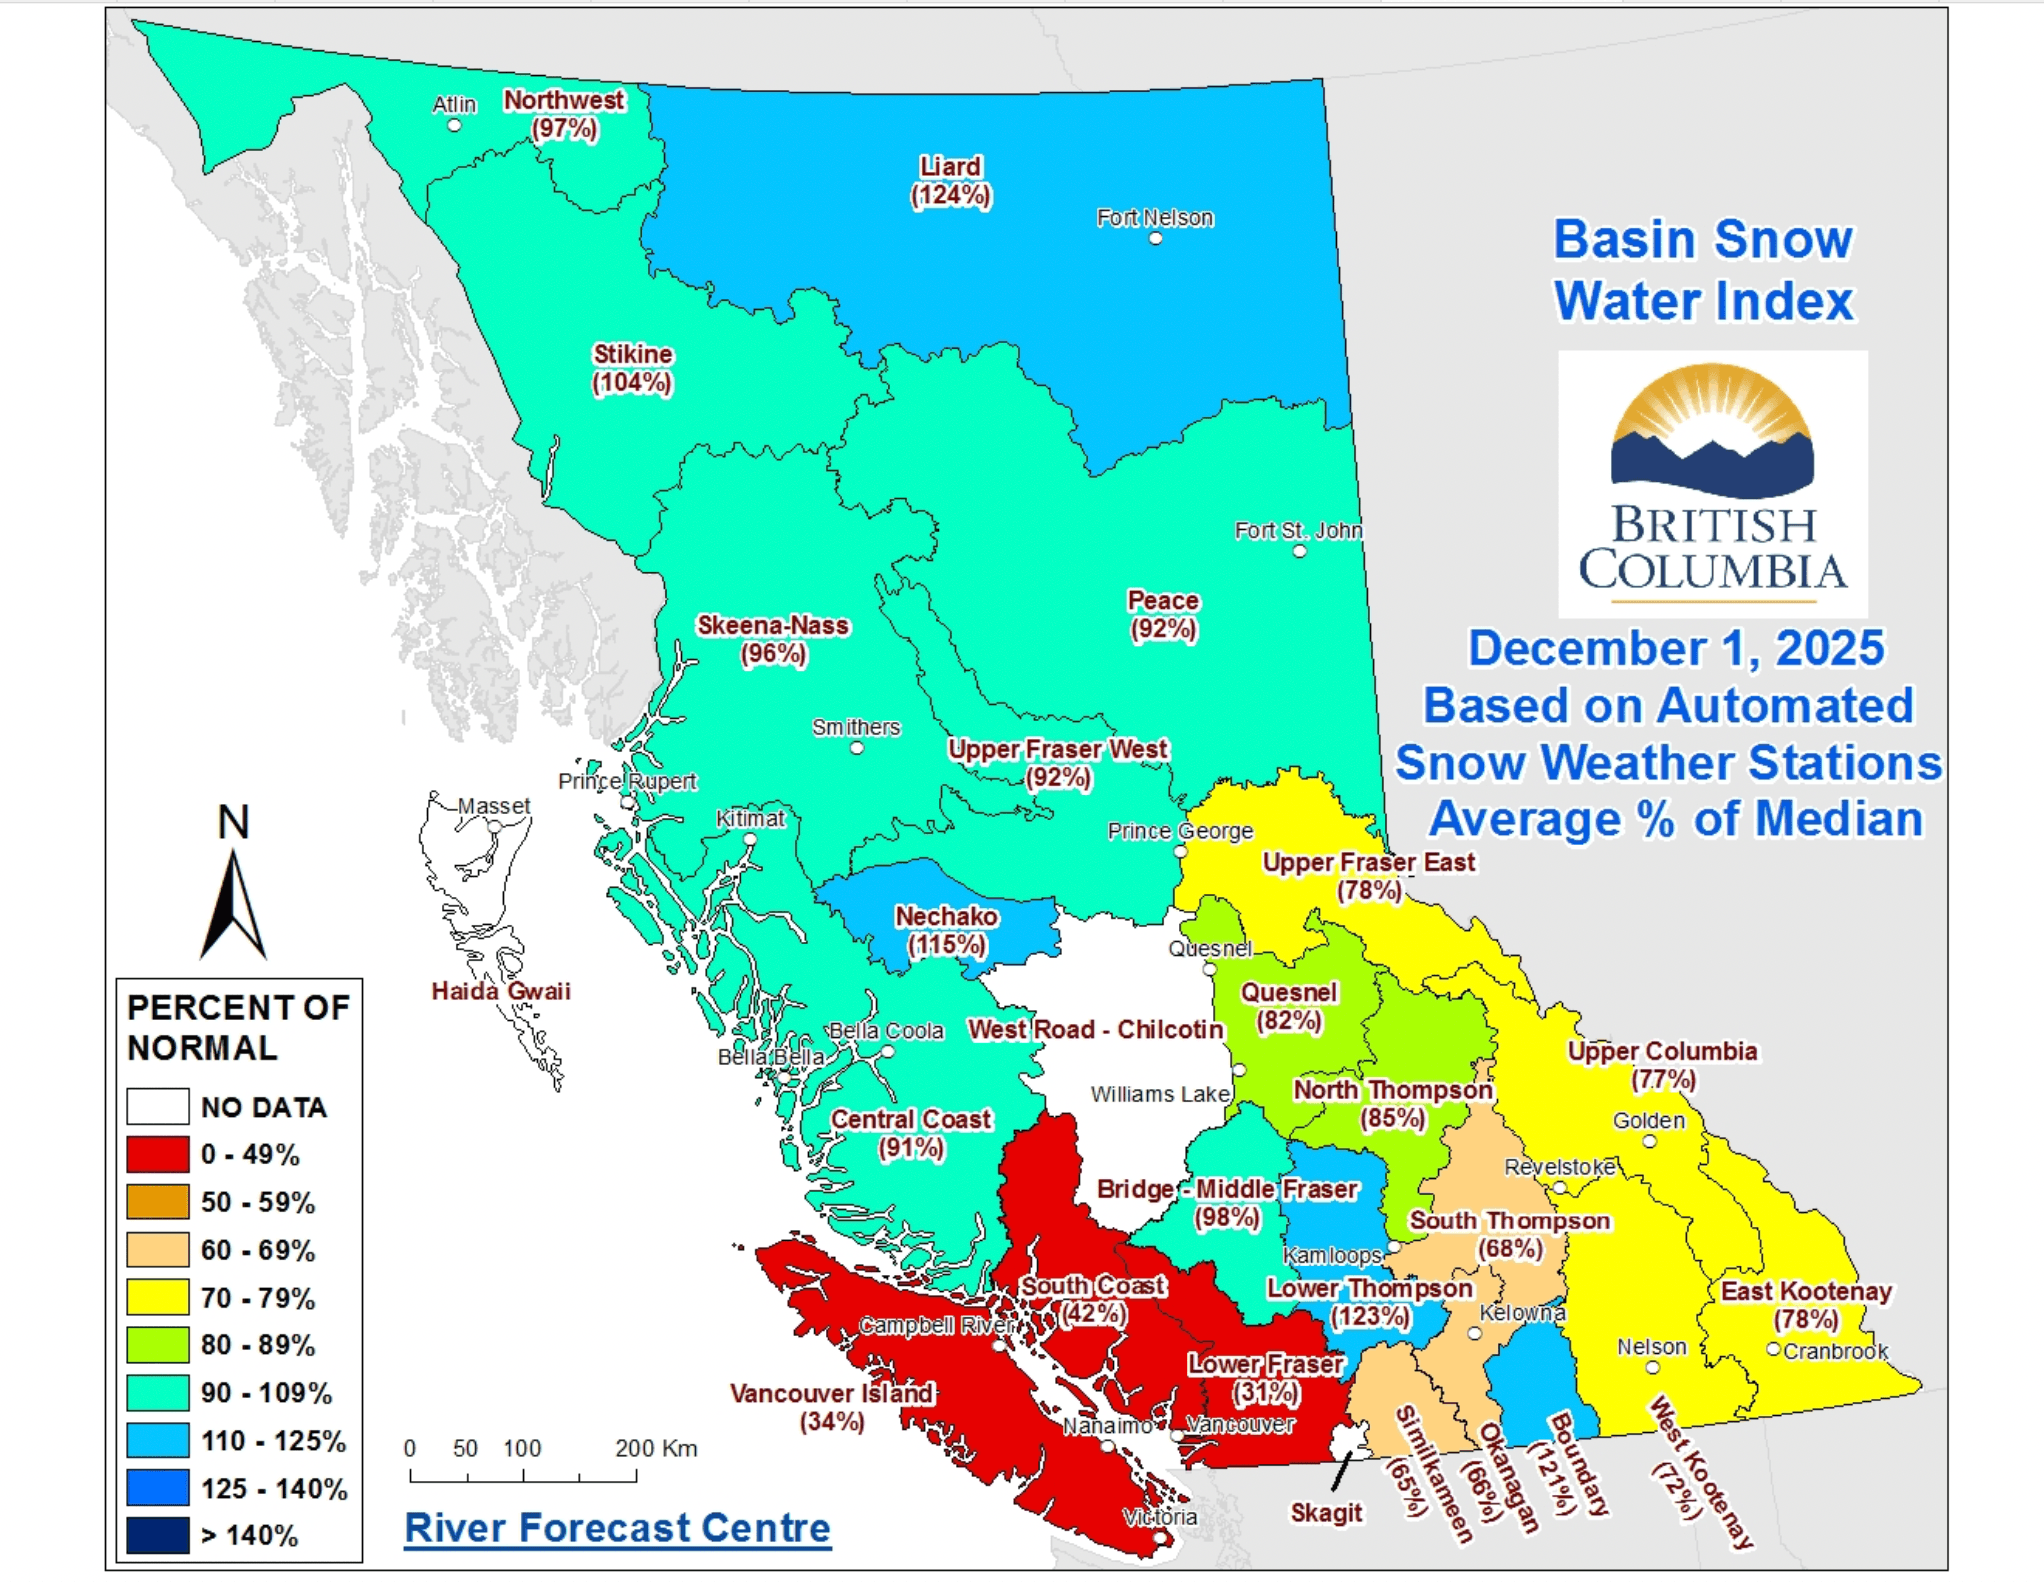
We often do not cover SWE totals in Canada. First, as far as we know, their SWE data, represented in an interactive map, requires looking at individual manual and electronic snow/rain monitoring stations in BC. However, the BC powers that be periodically release a map of SWE totals. The latest we can access is from December 1. A long, long time ago, if we take the recent atmospheric river into consideration. That noted, things look sweet, or at least sweeter.
Leave a Reply
You must be logged in to post a comment.