Digital mapping apps are essentials tools for most of us. Our reliance on them should come with some caveats. Let’s consider digital elevation models and their promise and shortcomings.
Last we focused on redundancy related to devices to communicate with emergency services absent cell service. That piece was a result of reflecting on personal practices and the January 4 avalanche on Togwotee Pass that took a life.
That incident’s final report has been released. With the insights and analysis of the Bridger Teton Avalanche Center (BTAC) and the avalanche survivors, we are afforded a huge learning opportunity—which we at THR do not take lightly considering the outcome that day.
Please take some time to read the full report.
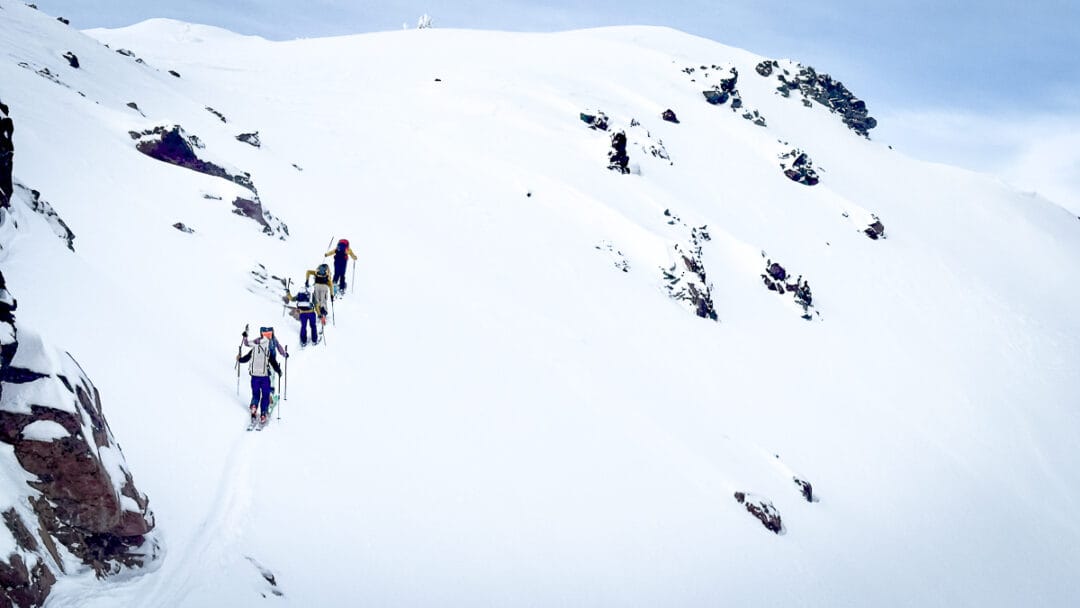
Here’s some context to clarify where we are heading. I’m planning a single-day solo traverse. We have had a solid week of high pressure which should present some optimal wintertime (read as firm and stable) conditions. However, I’m concerned about three short sections en route. However, I expect the three sections of concern to be stable. (A thanks goes out to Patrick Fink’s recent field report).
As part of my planning, I’m relying on my digital mapping app, onX in this case, to eye slope angles, and some potential re-routes if conditions are not as expected. Although I think mapping apps are helpful, I was reminded of their limitations while reading the recent BTAC report.
Digital Elevation Models (DEM)
The BTAC report contains a lucid section on the use of digital maps and their digital elevation models. The onX website explains DEM and slope angle, the overlay on which I am most likely to interface with the DEM. “Slope angles, and most terrain analyses, rely on Digital Elevation Models (DEMs), which are digital representations of the height of the earth’s surface at any given location.”
Reading the incident report, I was reminded that not all mapping apps or maps within a specific app use the same DEM. Some DEM tap into Lidar images/data for a very high terrain resolution, while others rely on DEM resolutions of 10m or higher. Sometimes, it’s below the 10m threshold. Lidar has the advantage of penetrating dense forest canopies to provide a better rendering of the underlying terrain. This capability can benefit skiers/riders who frequent forested terrain.
But not all slope angle maps, or maps in general, are equal. The DEM can depend on the availability of Lidar in specific zones and the type of data your mapping app has integrated into its code.
Another must-read is a 2020 The Avalanche Review article by Jeff Deems titled “Digital Mapping: Do You Know What Your Map Knows?” In this article, Deems lays out the backcountry tourists conundrum. “Because of this variety of elevation measurement technology, digital mapping techniques, and sensor resolution, DEM accuracy varies by location. Different techniques and measurements have varying abilities to map surface elevation in complex terrain or under forests.
“Additionally, terrain features that are smaller than the grid size can be missed….The end result is a complex and spatially variable pattern of elevation errors and data quality.”
Deems continues to argue, rightly so, that how the slope angle is represented on your digital map is greatly affected by the coarseness of your map’s elevation model. Again, is it 10m and above, or below 10m? That makes a huge difference.
(Not one of us hasn’t made a questionable decision in the backcountry. As noted in the communication device redundancy article, we may just get lucky and misattribute luck to smarts and experience.)
BTAC writes in their report that part of what may have gone awry on January 4 was relying on a lower-res DEM that didn’t precisely illustrate the on-the-ground terrain complexities. “… digital elevation models commonly used on mapping apps can be deceptive. If the map uses a 10m (33 foot) resolution that means a cliff 9m (30 feet) tall may not show up on the map,” claims the accident report. “Indeed the map this group used underrepresents the steepness of the cliff bands above their route as well as the small, steep sidewall directly in the path of the group’s skin track.”
The avalanche was a remote trigger as a group of four skinned in below 30-degree terrain. Above the group loomed a steeper avalanche-prone slope that released.
(In the BTAC report, the caption describing the images above states, “Note the increased amount of orange and red terrain in the higher resolution terrain model.”)
Many variables contributed to this sad event. The focus here is on DEMs and their potential unreliability. BTAC adds this prescient statement we should all heed: “Whatever the resolution of the DEM, paying attention directly, without the bias that a digital slope angle map may convey, is critical.”
We will not dive into each mapping app’s DEM. Sure, Lidar-based DEMs are available for some locations. But mostly, the terrain we travel in is rendered in lower resolution, 10m or above DEMs. As a result, slope angle images are best used as an approximation, not a definitive template on which we base critical choices.
These mapping tools are very useful. And they are improving. They are not better than what we may see and sense in the mountainscape.