To some, it is, the Greatest Snow on Earth. Mountain meteorologist from the University of Utah, Jim Steenburgh, discusses forecasting in the Wasatch ten years on from the publication of his book, Secrets of the Greatest Snow on Earth


Professor of mountain weather forecasting: Jim Steenburg.

Jim Steenburg at the U: he runs the Wasatch Weather Weenies site and helps run the University’s Mountain Meteorology Group. Photo: Courtesy University of Utah


Wasatch locals and those who lust for the greatest snow on earth know of Jim Steenburgh, the brainchild behind Wasatch Weather Weenies—Mountain Meteorology and Snow Snobbery. Steenburgh’s blog is a digital go-to for those interested in mountain weather forecasts and how and when to line up the steep with the deep. Steenburgh is also the author of Secrets of the Greatest Snow on Earth, Second Edition: Weather, Climate Change, and Finding Deep Powder in Utah’s Wasatch Mountains and Around the World, originally published in 2014, while a new second edition was released in June. 

For 28 years, Steenburgh has been a professor at the University of Utah in the Department of Atmospheric Sciences, and specifically helping lead the Mountain Meteorology Group. He’s a backcountry skier bent on helping others understand the dynamic realm of mountain weather and forecasting. However, Steenburgh grew up in the western Adirondacks where he became familiar with the big dumps amidst the tug Hill Plateau.

Along with his book, Steenburgh teaches an online class geared towards meteorologically curious powder snow seekers titled: Secrets of the Greatest Snow on Earth. Steenburgh has the secrets and we’re in a kiss and tell mood. We had a recent chat with Steenburgh to learn more about his evolving knowledge of the Wasatch and the information he has gleaned since first publishing his book. 

The interview has been condensed and lightly edited for clarity. 


The High Route: I am curious from the macro level. It’s been a decade since you came out with your book, and since then, there’s been a lot of discussion in the mainstream media about the shrinking Great Salt Lake and its adverse impacts. Over, say, a decade, what have you learned about what’s going on regionally when it comes to the lake and impacting mountain weather?

Jim Steenburgh: We’ve been in this persistent mega-drought, if you want to call it that, for about 20 years. What we understand is that it’s probably partially related to natural variability. Some of it’s just bad luck. But what’s changing now is we’re getting what we sometimes call hot droughts, which are droughts that are hotter than they used to be.

What’s happening is the hydrologic system is changing. Because of that, evaporation and transpiration happen a lot faster, soils dry out faster, and there’s a high demand for water, whether for irrigation, farming, or irrigating your backyard. 

This is an enormous challenge in the future with climate change. If we get the same inflows for the Great Salt Lake as we typically have had in the past, even if you just allow all the water to flow into the lake, the dice become loaded, making it harder for the lake to maintain a reasonable level. And then on top of that, for the last four decades now, we’ve been siphoning water off that should be going to the lake. And so, the biggest reason the lake is down is human diversion, which has been exacerbated during a drought period. 

These are some big challenges. It’s going to be very hard, I think, to, in the very long run, manage the lake without somehow getting more water to it. I don’t know. And I don’t know how to solve that. That’s not a meteorological problem. That’s a political and an engineering problem.


The High Route: One thing that comes up, and I know you wrote about this a while ago, is the over-emphasis on this whole idea of lake effect snow. For people who don’t live in Utah, like me, can you describe a little bit for people who don’t live there, or for perhaps even people that live there, what is the true impact of The Great Salt Lake when you’re talking about mountain weather in your zone of the Wasatch?

Steenburgh: In the Cottonwoods, it’s about an average of about 5% of the cool season precipitation, so from October through April. We’ve done studies that vary from year to year: it can be as much as 10 or 12%. And it can be as little as almost zero. It depends on the patterns in any given year. 

We have lots of southwesterly flow storms, and you don’t get much lake effect. If you get lots of northwest flow, we start to get more. That was based on a study over about a 10 or 13-year period when the lake was near or just below its average elevation and area.

I usually tell people about 5% to 8% of the total snowfall in the Cottonwoods is lake effect. Outside the Cottonwoods, if you’re up in the northern Wasatch, or if you’re on the Wasatch back, or if you’re down in the southern Wasatch, it’s a lower number than that. 

Everybody talks about lake effect, but if you look at a year, like last year, where Alta just got destroyed, right? Nine hundred three inches of snow, the vast majority of that was not lake effect. 

If you want to see lake effect, you go to a place like upstate New York, and you go to Tug Hill Plateau, and they average about 280 inches a year, but that’s a much bigger lake; Lake Ontario is 300 kilometers long, whereas the Great Salt Lake is about 100. Or if you go to Japan, you know, they’re much larger bodies of water, they produce a lot more lake effect.


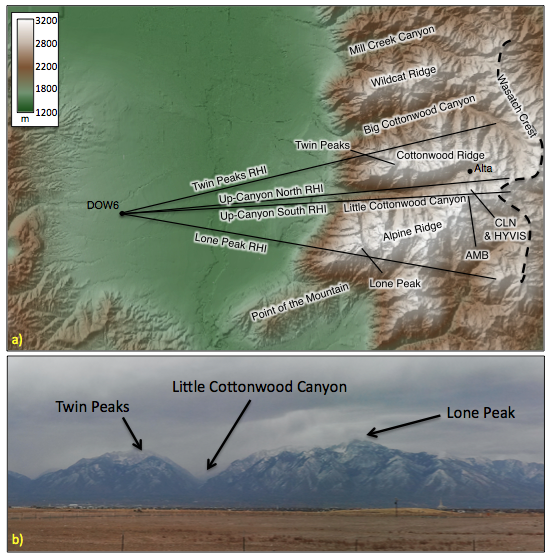
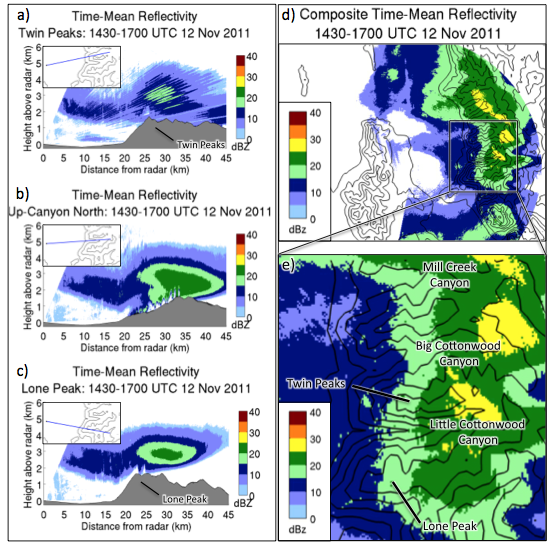
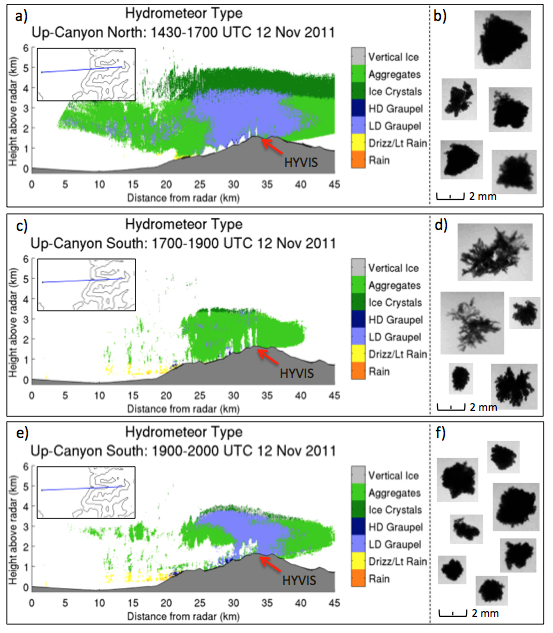
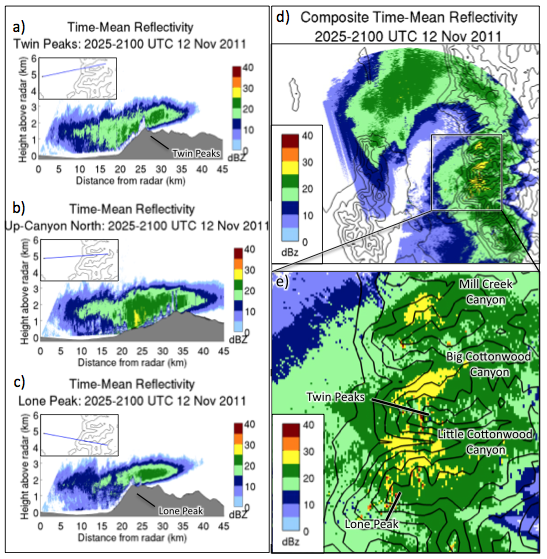
Even if you don’t reside in the Wasatch, the Weather Weenie site is well worth a deep dive. For example, an April 8, 2014 post titled “A Cool Look at Snowfall in Little Cottonwood Canyon,” highlights the data collected from specifically positioned radar as a winter storm rolls through. By reading the site, and following Steenburgh’s lead, your mountain weather forecasting skills will improve. Below is a series of four images found in the April 8, 2014 post.

a) Position of the DOW and orientation of the RHIs over the Salt Lake Valley and central Wasatch Mountains. b) View of the central Wasatch Mountains from the DOW site. Source: Campbell and Steenburgh (2014)

a) Position of the DOW and orientation of the RHIs over the Salt Lake Valley and central Wasatch Mountains. b) View of the central Wasatch Mountains from the DOW site. Source: Campbell and Steenburgh (2014)

Prior to the frontal passage, we observed a pronounced "barrier-scale" mountain wave that resulted in stronger radar returns in the upper Cottonwoods and along the Wasatch Crest as one often anticipates during winter storms. Most interesting in this case was that the strongest radar returns were displaced to the east of Lone and Twin Peaks.

“Prior to the frontal passage, we observed a pronounced “barrier-scale” mountain wave that resulted in stronger radar returns in the upper Cottonwoods and along the Wasatch Crest as one often anticipates during winter storms. Most interesting in this case was that the strongest radar returns were displaced to the east of Lone and Twin Peaks.”

The DOW is also a polarimetric radar (meaning it transmits and collects radar signals in both the horizontal and vertical planes), which allows us to infer the types of snow crystals in the storm. Below you can see where and when ice crystals (small ice particles), aggregates (clusters of snowflakes), and low-density graupel are found.

“The DOW is also a polarimetric radar (meaning it transmits and collects radar signals in both the horizontal and vertical planes), which allows us to infer the types of snow crystals in the storm. Below you can see where and when ice crystals (small ice particles), aggregates (clusters of snowflakes), and low-density graupel are found.”

“Following frontal passage, we observed something completely different. Behind the front, the northwesterly flow was very shallow and was unable to surmount the high Cottonwood and Alpine ridges around Little Cottonwood Canyon. As a result, the strongest radar returns were over the lower canyon, especially the northwest facing sidewalls of both Big and Little Cottonwood Canyons.”


The High Route: Since the 10 years from the first edition of your book, how has the modeling changed, specifically the accuracy considering mountain weather scenarios?

Steenburgh: The biggest improvements have been in what we call large-scale global scale forecasts. There are a number of groups around the world that run Global Forecast models, and these are the backbone of weather forecasting. Because even if you have a high-resolution model, if you can’t get the large scale right, the detail that that model is going to give you will have lots of problems with it. 

So over the last 10 years, these global models have continued to improve for many reasons. Those reasons include improvements in observation, satellite observations, in particular, improvements in the techniques we’ve used to assimilate those observations into the model because every numerical model needs something to start with. 

There have been improvements in model physics and resolution, and details that have been enabled due to computer horsepower or a better understanding of atmospheric phenomena, for example. So you put all those things together, and now we have a much better suite of global forecast models.

People talk about the Euro model or the ECMWF model. That’s thought of as the number one model out there right now. But the US models — as it is an entirely different modeling system compared to 12 years ago — are basically a whole new model, based on a completely different dynamical core, and upgraded it. 

And so we have these global models we call ensembles: each of these modeling systems runs many, many members with slightly different initial conditions — this helps us understand the uncertainties. So those have been really, really good.

Since 2014, within the United States, some of the models have improved in resolution and detail a little bit. But, the only model that the National Weather Service runs regularly, the model at high resolution, is the HERRR (High-Resolution Rapid Refresh), which was around when I wrote my book. And it’s still at about the same grid spacing. But they run a few different versions of that. It’s called the HREF, the high resolution ensemble forecast system, and a couple of other models. 

But I think the biggest improvement over the last 10 years, even though models have gotten more detailed, has to do with the quality of the forecasts in general. I think that’s largely due to the improvement in the global models. If you were in Europe, though, say you were in the Alps, they have been running at higher and higher and higher resolution. So if you were in Switzerland, for example, they would have a model at one-kilometer grid spacing. But in the US, we’ve plateaued at three kilometers for our highest resolution operational model now for a while.


The High Route: How would that technological gap manifest when you’re looking at the resolution of a kilometer compared to three kilometers? 

Steenburgh: The only thing that limits the resolution is computer power and, maybe, how you prioritize using that computer power. There are always decisions; you only have so much computer power to play with. The National Weather Service has a tremendous amount of responsibilities to cover, basically, all of North America, even though the Canadians run their own system, we have to cover Alaska, Hawaii, and Puerto Rico. It’s an enormous area, so throwing a lot of resolution once in a while in a small area is hard when we have to deal with things like hurricanes. 

The National Weather Service runs this large suite of computer forecast models. Right now, they’re transitioning to a new forecast system. They’re trying to transition everything to this unified forecast system. So things have been frozen for a few years as they’ve been developing this new system. And what’s going to happen in probably 2024 is they will replace the high resolution Rapid Refresh, HRRR, with what’s known as the Rapid Refresh forecast system, sometimes called RRFS (rufus). The National Weather Service loves acronyms, but it’s going to be an eight member ensemble. So instead of doubling the resolution of the HRRR, they’re going stick at around three kilometer grid spacing, but you’re going to get eight forecasts. And that will be a big improvement. 

It will allow us to quantify better, for example, precipitation in mountainous regions. So that’s where it’s a trade-off: the grid spacing value, for example, is one of many things to consider. Ensembles are really important; we’ve known that for a long time. Finding the right balance is a challenge.


The High Route: So knowing what you know, to drill down one last time on this particular aspect of a kilometer grid spacing versus three kilometers, and then thinking about 2024 and the eight forecast ensemble: as a backcountry skier, and you know this obviously, the difference between a kilometer and three kilometers is considerable. Taking the best-case scenario of each system, how might that manifest for a backcountry skier? Would we notice a difference?

Steenburgh: It would depend on where you live and where you are touring and on what variable you’re looking at. So, for example, if you’re trying to understand how much it’s going to snow where you are in the Cascades, you can get away with a somewhat lower resolution model to some degree because of the terrain, as the Cascades are a pretty broad mountain range, around 100 kilometers across. If you’re here in Utah, where the mountain ranges are 10 kilometers across, if you’re running a 10-kilometer grid spacing, you don’t even see our ranges. So there’s a huge penalty paid for wider grid spacing in some areas compared to others. 

On the other hand, there’s a difference between physical realism and accuracy. And so high resolution models today have a tremendous amount of physical realism. But if they don’t get the wind direction right, then the fine-scale details are going to be wrong, and you get big forecast busts or large false alarms, for example. So just cranking up the resolution doesn’t always get you everything you want. If I had a choice between a single model run at, say, one-kilometer grid spacing and, say, a 10-member, three-kilometer ensemble, I would probably want the ensemble because it would allow me to see a little more of the sensitivity of the forecast, the small changes, and that can be important in complex terrain. 

It just depends. That said, we’re reaching a point where it’s a cake-and-eat-it-too problem. The approach that I have taken to dealing with lower resolution models is to do downscaling, machine learning, and other techniques to add in detail. And I think you’re going to see a lot more of that in the near future. 

There are machine learning techniques now that show a lot of promise for global forecasts; they run in seconds instead of hours. A lot is happening. It’s a pretty exciting time. Although the hardest part in complex terrain is getting good training datasets to do some of these statistical tricks because we don’t have good radar coverage in complex terrain, so the variability is a lot higher than we can sample. So that becomes a challenge. 


The High Route: For your average layperson, and let’s assume it’s someone who has some familiarity with going online, reading the forecast discussion, and they don’t subscribe to a weather forecasting service. For backcountry skiers who want to up their game in terms of weather forecasting, what type of resources would you have them engage with?

Steenburgh: Yeah, you know, the hobbyist crowd, some of them are pretty good forecasters. The computer models have leveled the playing field, as they’re the backbone of forecasting. So, people come up to me sometimes when I’m out ski touring; if I haven’t looked at a computer model in a couple of days, they probably know more than I do about what the weather is going to do.

Some people think I lick my finger and hold it up to the wind, and we can figure it out. But that’s not how it works. These computer models are everything for forecasting. 

So the main thing that experience gets you is experience with what situations that computer models do well, and then feeding in local conditions, like, what happens in Bend, for example, under certain flow directions — some people might understand that. That’s an experience thing.

But if you’re a hobbyist and you’re out ski touring a lot, and you’re looking at the models regularly over a couple of years, you can get pretty good at anticipating what’s going to happen whether you’re a meteorologist or not, as long as you have a good nose for the weather. 

The things that I look at, I use MesoWest pretty religiously. MezoWest is this network of networks. It was developed here at the University of Utah, where John Horrell was the leader of that group. He would go out and contact people at weather stations or weather networks, and he got him to provide stuff, and many skiers in the western United States provide data to MesoWest and SNOTEL stations. For me, the forecast starts with the data. So I like to look at MesoWest a lot. I also like to look at satellite and radar imagery. And I have some programs I run on my computer that are not necessarily out in the public domain, so I do that too. But there are a lot of really good radar sites, like RadarScope, that many people like to use.

For satellite imagery, I often use the College of DuPage site; it’s quite good for looking at it quickly. But I also have software on my computer here that allows me to do overlays and turn things on and off in ways you can’t do online. 

But our site here at the University of Utah, it’s pretty much designed for the mountain weather community, I say that because most of the products are made for me. There are a lot of products there that you can look at are useful. 

One of the things we have on our site that many sites don’t have are Time Height sections for many mountainous places. They are very popular with weather forecasters amongst the pro community. The Time Height sections are just profiles, say every hour, for the specific model for a set location. Over time, you can look at that and see how the weather will evolve and understand if a front is coming in or if the winds will change those kinds of things. 


The High Route: Last winter and spring was a big cycle for snow. As someone who’s a scientist, how do you temper expectations for the upcoming winter? You know, having a big snow year doesn’t necessarily mean there is a trend going into the next year — It’s a one-off. How do you discuss that with people after such a banner year?

Steenburgh: My usual line is that we’re not very good at seasonal forecasting. I’m always amazed this time of year and the stuff you see about people claiming what winter will be like. It’s a two-way street, though: there are people that put out these forecasts, but there are also people that are consuming them. I get lots of people asking me, “What’s it going to be like, this winter, and I’m like, “I have no idea.”

This year is a fairly strong El Niño year. That might load the dice a little bit for some areas. 

But, for northern Utah, for example, we don’t correlate very well with this cycle. For Northern Utah, in particular, I have no idea what will happen. And I’m perfectly comfortable telling people that. It’s not right to say we somehow know more than we do.

And if we don’t know, we don’t know. And so, for this area, that’s the case. 

Now, the dice are really loaded for above-average temperatures, too — even though last year ended up being cooler than average — the bottom line was we live in a warmer climate system now. Last year, we got a pattern that really locked in and allowed us to stay cool, but it’s tough to get that down. 

Seasonal forecasting is not very good. We know from tree ring data in some parts of the Western US that there are these longer-term variations where we can go through a decade or two that’s wetter and a decade or two that’s drier. We don’t really understand what controls all that too well; we know it’s related to changes in the Pacific Ocean currents and, you know, the PDO, they call it (Pacific Decadal Oscillation).

Anticipating how that will affect any given year, you’re talking about relatively small correlations. So their practical value for anticipating what’s going to happen is pretty low. Ski it if it’s white, you know. 

We don’t necessarily want another year like last year from a skiing perspective. It snowed too much. 

I talk about Goldilocks storms all the time, but there are Goldilocks seasons. And what I learned last year about Little Cottonwood Canyon is that anything over 700 inches is probably too much snow; the canyon was closed sometimes for days at a time.

The best part of the spring ski season where I like to go to the upper elevation, alpine terrain in Little Cottonwood in April; you couldn’t even drive up the canyon. We would have been better off with 700 or 750 inches of snow. The last 200 inches was too much.