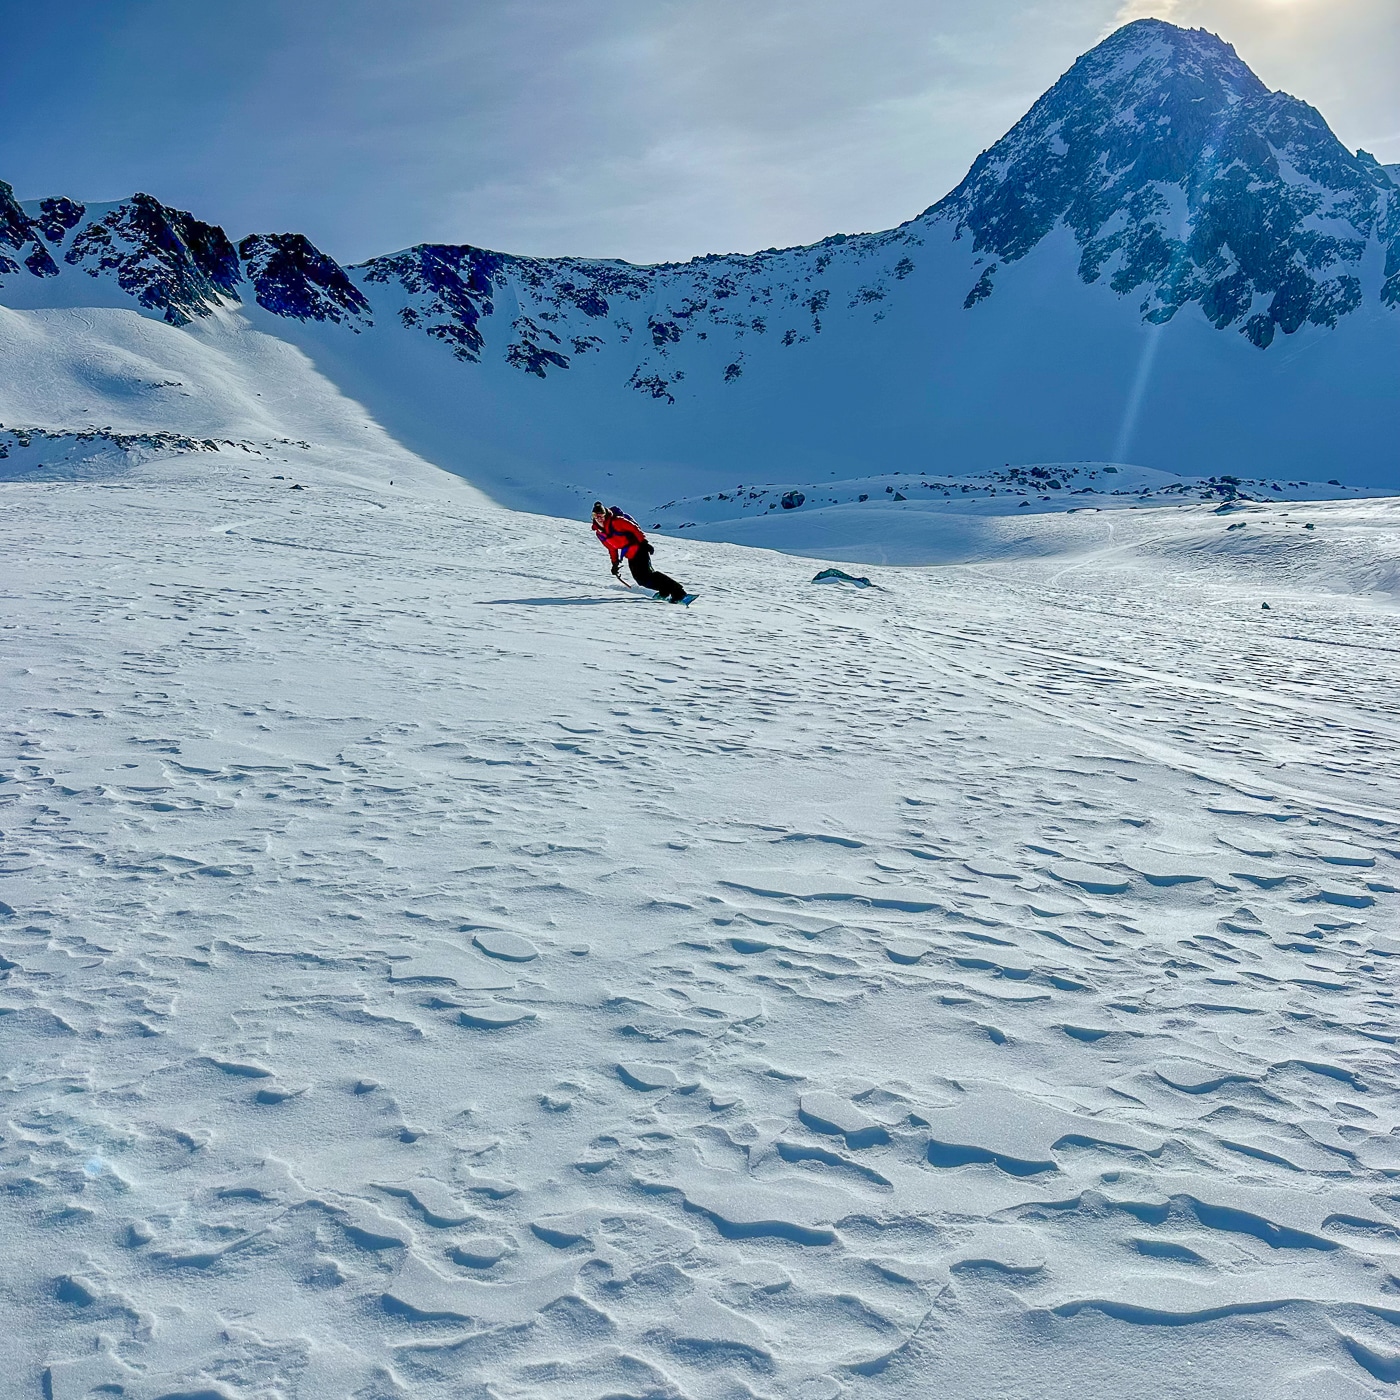
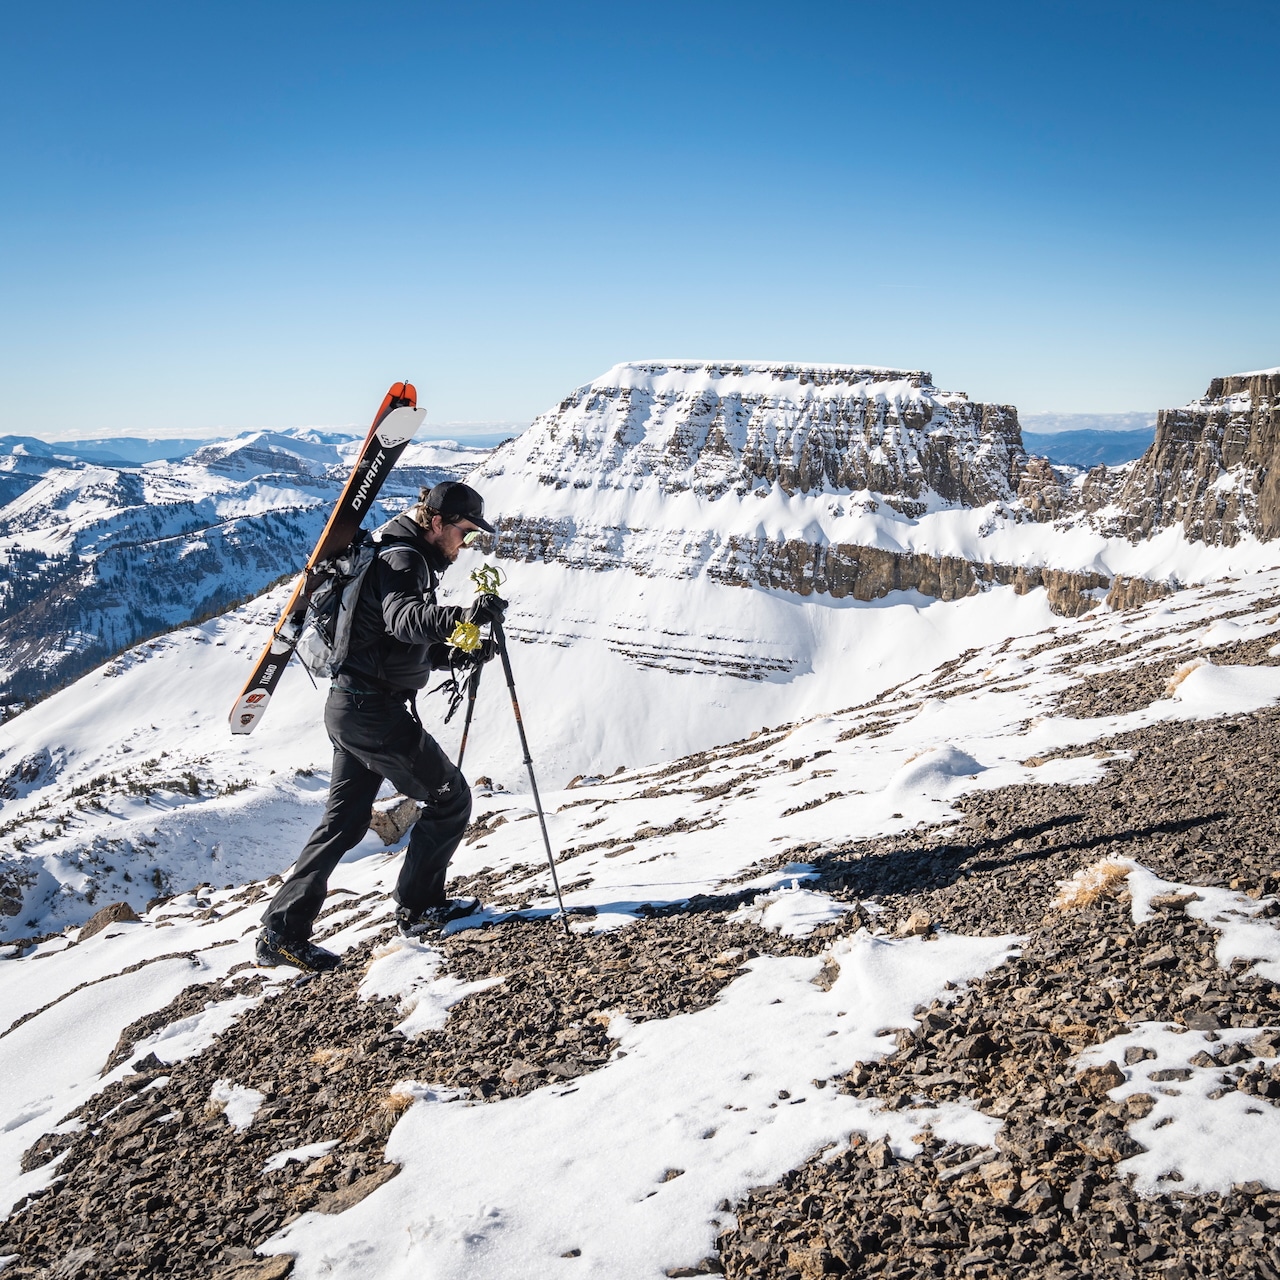
An early season Snow Water Equivalent (SWE) check in—wax and scrape your snow sliding tools.
Last season at The High Route, we habitually checked in on regional/basin-wide SWE, or snow water equivalent, throughout the season. First, why, as backcountry tourists, are we concerned with SWE and not simply the cumulative snow depth on the ground?
SWE is a way of describing the density of snow, or the snow-to-liquid ratio (SLR). Nowadays, scientists describe a typical snow-to-liquid ratio as roughly 12:1, or 12 inches of snow equates to 1 inch of water. As ski tourists, we become attuned to different SLRs, even though we may frame it in slightly different terms. Dry powder, the good stuff found in the Wasatch, could have an average SLR of 14:1 to 16:1. (A 2011 University of Utah news archive cites an event where a storm dumped hyper dry snow with an SLR of 35:1. Talk about low density.)
That 35:1 snow is sweet to powder surf on, but it does little for the arid West—it’s low SWE. Controlling for volume, 35 inches of snow constitute 1 inch of water.
Some of us may look at SWE from storm cycle to storm cycle to determine how fluffy, or cement-like, the snow may be. Others may use SWE data to better understand the overlying load on an underlying–and potentially weak—layer. Hydrologists may look at SWE as a function of how much water may be available for agriculture, certain municipal uses (like drinking water), and long-term reservoir storage.
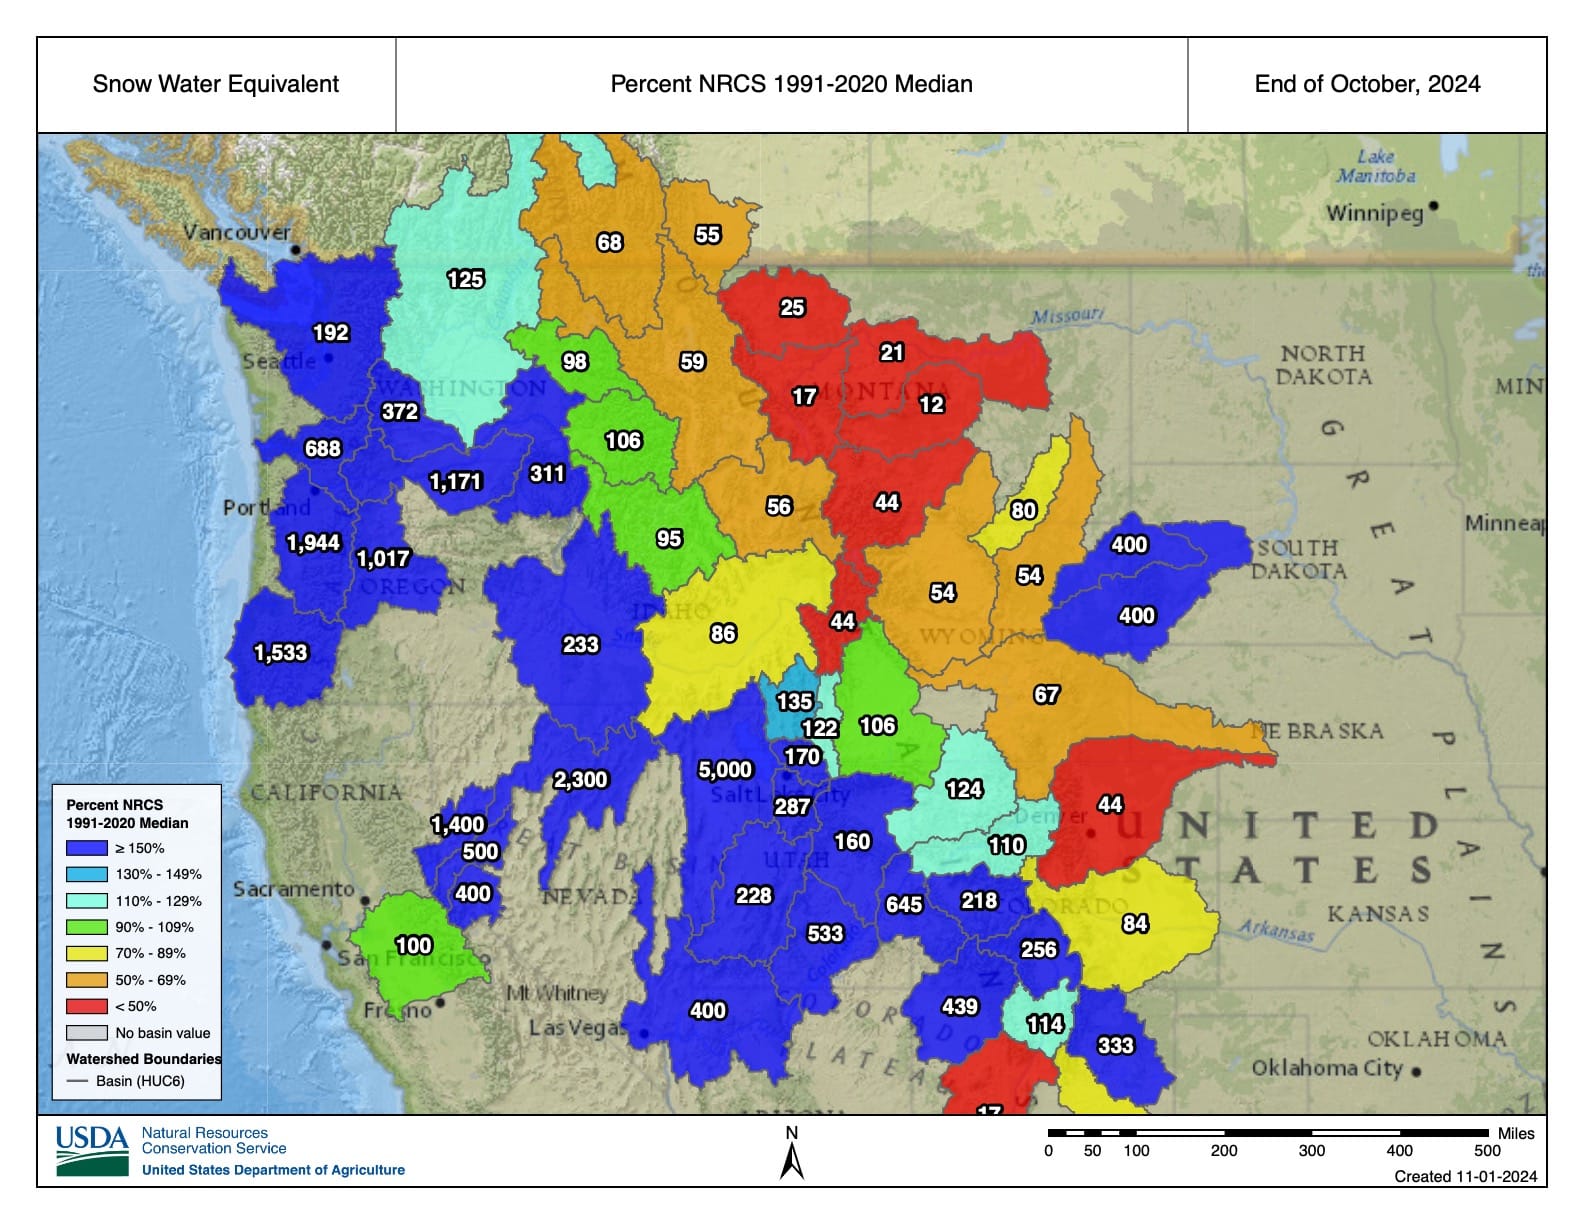
Here at THR, we often look at river basin maps illustrating water year to date compared to the median from 1999-2020 to see how much snow is on the ground. (The maps we examine display water year to date as a function of SWE.) The water, in much of North America, for example, is locked up as snow, until the spring thaw. So, by looking at water year to date as a % of a long-term median, we get a good idea of how much snow sits on the ground. These are useful metrics for those who like to tour into summer.
October concluded yesterday, so we’ll check out our first “water year to date” graphic. This makes sense for a few reasons. The U.S. Geological Survey (USGS) begins its water year on October 1. That makes sense here in the Northern Hemisphere, as snow can fall and accumulate in higher latitude and/or elevation regions around this time. It also just so happens that it is currently dumping in the local hills. We might as well glance to formulate a baseline for the early season. Let’s take a look. And just so we are clear, the maps below look at the median for October. With the snow/moisture moving through the West now, we expect the percentages displayed to bump up over the weekend. Scrape the skis/board; it may be time. The percentages are looking good (as is the snow cam at 5:30A.)


