Checking out snow coverage outside Lander, WY with Sentinel Hub—the image is from Jan. 27, 2024.

Checking out snow coverage outside Lander, WY with Sentinel Hub—the image is from Jan. 27, 2024.


Here’s another digital asset, Sentinel sat imagery, for eyeing conditions and terrain from afar.


Before Strava, Facebook groups, and Google Earth, aerial photography was a vital tool to a ski mountaineer’s toolset. Photographers like Bradford Washburn and John Scurlock had (and have) provided invaluable information in the form of pictures of mountain faces. It wasn’t long ago that flipping through photo albums of mountains was the standard way to find new and unexplored terrain. There still is no replacement for the resolution of an aerial image or photograph from the ground, but modern tools are catching up quickly.

New technology has opened more digital tools for backcountry skiers. Caltopo, Gaia GPS, OnX backcountry and others have improved mapping software exponentially. Google Earth allows for brainstorming and “scoping” lines at home, from the safety of your kitchen table. One digital tool that can be overlooked, though, is Sentinel satellite imagery. 


The Sentinel Network

The Sentinel satellite network was launched by the European space agency in 2015. The purpose is to take regular images of the earth’s surface for a variety of scientific purposes; but the benefit for skiers is every few days there are updated aerial images of terrain to view. How can this be useful?

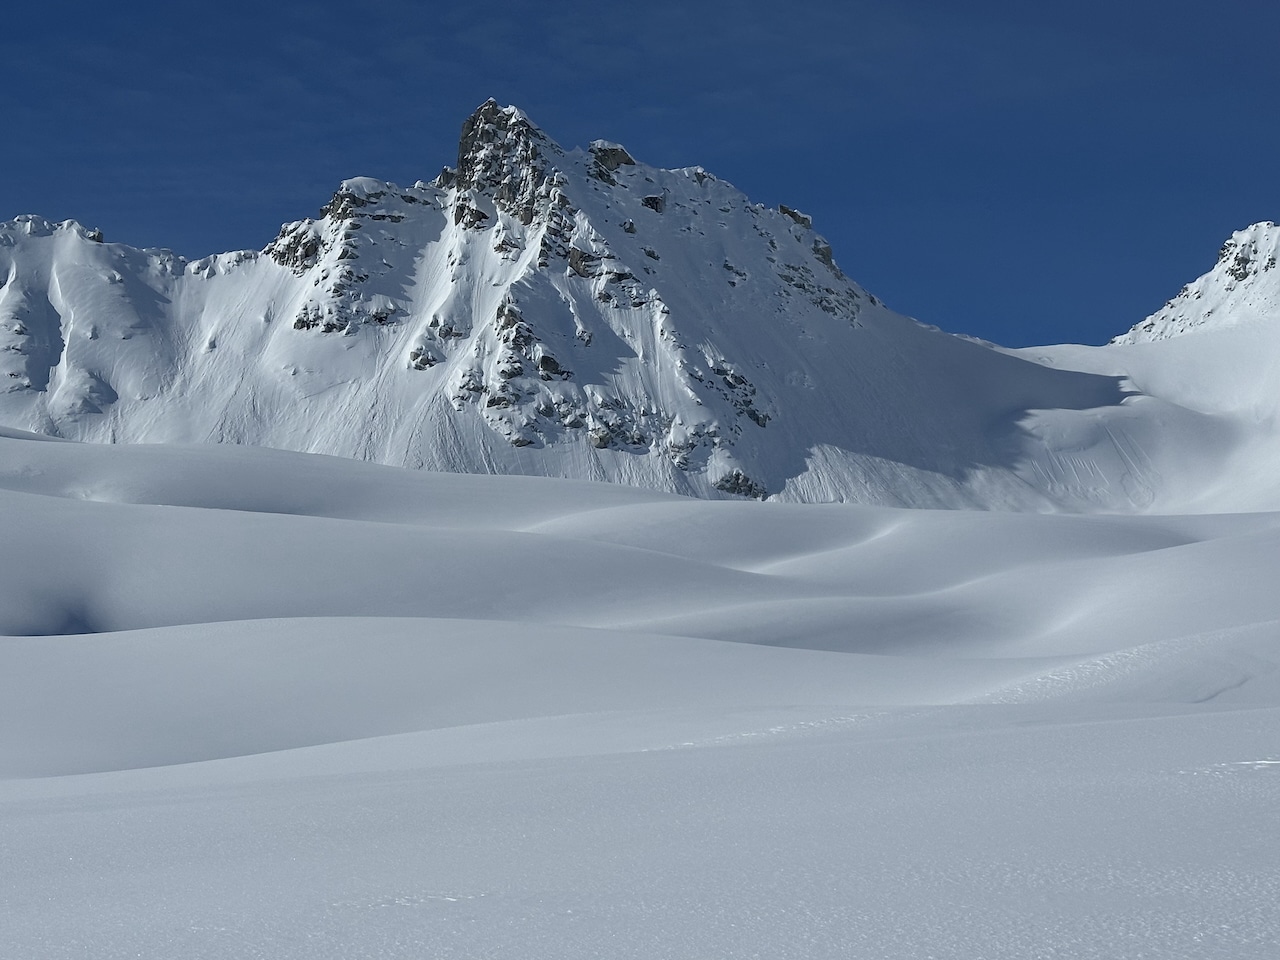
Sentinel imagery can be a useful supplement to monitoring weather, snowpack, and terrain. You can see an aerial view of snow coverage, glacial conditions, and generally what the snow surface is looking like from a bird’s eye view. While it does not directly provide you with snow depth, snowpack temperature, or snow surface characteristics, it’s useful for wondering if that valley approach is in or how the coverage is looking in a particular area.

How can you access it?


Cal Topo

Cal Topo has a layer in their Premium subscription where you can toggle between different days of Sentinel imagery.


Finding Sentinel images in Cal Topo.

Finding Sentinel images in Cal Topo.


With it, you can toggle various types of imagery. I typically use the True Color layer, as it’s the simplest to interpret. However, you can also experiment with different wavelengths.

In wintertime, it can be tricky to get good satellite imagery when cloud cover is so frequent and widespread. However, now and again, you can get lucky when there’s a clear day for Sentinel to capture great imagery.


As an example, the image above was taken on 11-Dec-2023 of the northwest side of Mt. Baker. In it, you can clearly see the Coleman Glacier and its crevasses; a clear sign of early season conditions and a sad, thin snowpack

11-Dec-2023northwest side of Mt. Baker.

For example, see the image above from 11-Dec-2023 of the northwest side of Mt. Baker. In it, you can see the Coleman Glacier and its crevasses, a clear sign of early season conditions, and a sad, thin snowpack.


Gaia GPS

I’m not a regular Gaia GPS user, but they have sat image capabilities on their platform called FreshSat. Gaia GPS merges the Landsat-8 (US satellite network) and Sentinel-2 (European Space Agency) imagery into their proprietary layer. The app offers FreshSat-Recent and FreshSat-Cloud free. FreshSat-Recent updates more frequently but includes all images, which includes cloud cover. FreshSat-Cloud Free culls images to exclude cloud cover; the downside is the images displayed may be slightly dated and, therefore, less accurate for discerning snow coverage. You can read more about it here


OnX Backcountry

I’m not a regular OnX user, but they, too, have similar capabilities on their platform. Their “Recent Imagery” base layer updates every two weeks. On the bottom of the screen (phone or computer), you can toggle through past and more current images (at two-week increments) to see how snow coverage, for example, has changed. You can read more about it here.


Sentinel Hub

You can get the Sentinel-2 imagery directly from the source for free. First, head to Sentinel Hub’s digital platform, the “EO Browser,” and then pick a place to explore. 


Select location.

Select location.

Specific location displayed.

Specific location displayed.


Your map will relocate to your search parameters, then select the imagery you want to display. You can then select and filter your data sources (in this case, there’s only the Sentinel-2 network for free) and the date range.


Click “Search,” and the site will load the latest imagery available. You can select different images which are timestamped.

When the images load, key data is included with each image, most importantly, date, timestamp, and % cloud cover for the image. Clicking “Visualize” leads to more image details and different color spectra you can load.


The Sentinel HUB also allows users to utilize the base map to dive into various images. For example, if you search for a specific area, tiles will load on the base map. Depending on your familiarity with the platform, this might be an easier way to select where you are trying to look. If you click on the tile, multiple image options will appear. This way, you can hone in on first WHERE you are trying to look, then select the image that will best serve your purposes (often the one with the lowest cloud cover %). There’s a learning curve here, so come with some patience—it’s worth the effort.  

There are a ton of features in the EO Browser you can experiment with, so I’ll leave it here as that should be enough to get you going on your own. 


Learning Resources

Sentinel Hub User Guide

Long-form Video Webinar for Using Sentinel Hub


Sentinel Hub:A clear (low % cloud coverage) image from Jan. 31 around the Aspen zone in Colorado.

Sentinel Hub: A clear (low % cloud coverage) image from Jan. 31 around the Aspen zone in Colorado.


How Is It Useful?

If you’ve ever wondered what the snow coverage is in a particular area but wanted to avoid going and scoping it yourself, Sentinel-2 imagery is a great tool. This function is particularly valuable in spring when scoping valley approaches and in the early season when wondering if your next trip will involve more hiking or skinning. 

I asked some of my community to chime in on how they use Sentinel. 


Spring Snowmelt

Kyle M. uses Sentinel “for assessing melt-out for spring skiing,” which includes determining if access roads are passable by vehicle. It’s a resource in his pre-trip process at home, bouncing between skiing possibilities. 

For another friend, Matt R., based in the Eastern Sierra, recent images help him estimate approach times and mode of travel. “I could accurately estimate how far I would be walking on dry ground before skinning,” he explained. “It helps eliminate the unknowns when going into a big day; dialing the approach and exit conditions goes a long way for confidence.”


Glacial Recession

Living in Washington, both Kyle M. and Wyatt M. are interested in using Sentinel to track glacial recession. “Many of our maps show glacial extent very different from present-day conditions,” Kyle remarks. 

Wyatt M. started using Sentinel in March 2023 for a personal project examining glacier recession. Sentinel imagery is key to Wyatt’s project, allowing him to compare and contrast images in different areas, at different times of year, and over different years.


Method for Using Sentinel

Another friend, Kyle J. (yup, two Kyles), almost always uses Sentinel imagery through Caltopo. He likes how he can “layer an assortment of data, from slope angle to contours, and flip back and forth with high-resolution summer imagery to really speculate what might be going on.” 

This ability to layer is one of the major benefits of using Sentinel imagery through mapping software like Caltopo, Gaia, OnX, etc. You can stack functionalities, getting the best of both worlds. 

However, one of the downsides of using Sentinel through Caltopo is the “guess-and-check method that comes from just picking the dates that Caltopo has available and waiting to see if there is cloud cover or not,” Kyle remarks. This is where the Sentinel Hub shines. It shows you a % cloud cover before you click on an image, so you know what you’re getting. Cross-reference an image on the hub, identify which days have the least cloud cover, then head back to Caltopo—a tactic Kyle J. often employs.


Charting out Your Route

With experience, Sentinel can be a way to chart your route through tricky navigational sections. Kyle J. uses Sentinel to “plan routes through bushy/alder choked areas, where a little bit of imagery can go a long way. Crevasses through Spring and Summer can often be seen too. Same for moats and cliffs. You can often tell what doesn’t go, but confirming what does go takes experience.” He often reflects on what he sees in Sentinel versus what he sees in the field after a tour, making it a productive learning experience. “Imagery is only a piece of the puzzle, but it sure is a luxurious one compared to what most of us were doing to plan our trips 5+ years ago, let alone 10+!”

Unfortunately, sentinel imagery still lacks the high resolution of an aerial photograph for scoping a line. Will this change in the future? Perhaps, for now, John Scurlock’s pictures will still have their place for inspiring new ski descents.